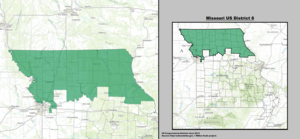
U.S. House district for Missouri
Missouri's 6th congressional district Interactive map of district boundaries since January 3, 2023
Representative Population (2023) 785,446 Median household $71,515[ 1] Ethnicity Cook PVI R+21[ 2]
Missouri's 6th congressional district takes in a large swath of land in northern Missouri , stretching across nearly the entire width of the state from Kansas to Illinois . Its largest voting population is centered in the northern portion of the Kansas City metropolitan area and the town of St. Joseph . The district includes much of Kansas City north of the Missouri River (including Kansas City International Airport ).
Rep. Graves (left) with George W. Bush at the Ford Kansas City Assembly Plant in Claycomo, Missouri . March, 2007. The district takes in all or parts of the following counties: Adair , Andrew , Atchison , Buchanan , Caldwell , Carroll , Chariton , Clark , Clay , Clinton , Daviess , De Kalb , Gentry , Grundy , Harrison , Holt , Jackson , Knox , Lewis , Lincoln , Linn , Livingston , Macon , Marion , Mercer , Monroe , Nodaway , Pike , Platte , Putnam , Ralls , Randolph , Schuyler , Scotland , Shelby , Sullivan , Worth .
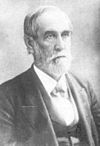
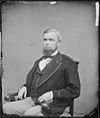
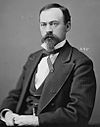
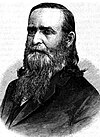
Notable representatives from the district include governors John Smith Phelps and Austin A. King as well as Kansas City Mayor Robert T. Van Horn . In 1976, Jerry Litton was killed on election night as he flew to a victory party after winning the Democratic nomination for United States Senate. The visitors center at Smithville Lake is named in Litton's memory. Democrat Pat Danner , a former aide to Jerry Litton, won the seat in 1992 becoming the first woman to be elected in the district defeating a 16-year Republican incumbent.
George W. Bush beat John Kerry in this district 57%–42% in 2004. The district is represented by Republican Sam Graves , who has held the seat since 2001. Graves easily held on to his seat what was expected to be a tough 2008 election, defeating former Kansas City mayor Kay Waldo Barnes by 23 percentage points.
Historically, the 6th was not safe for either party. However, in recent years, it has trended Republican, mirroring the increasingly conservative bent of the more rural areas of Missouri that historically voted for Yellow Dog Democrats .
Redistricting following 2010 census [ edit ] After Missouri lost a congressional seat following the 2010 census (in part because of losses in population in several rural northern Missouri counties), the 6th was expanded to include most of Missouri north of the Missouri River, stretching from border to border from Kansas to Illinois. The biggest geographic addition was in northeast Missouri (including Kirksville, Missouri and Hannibal, Missouri ), which used to be the northern half of the old 9th district .[ 3]
The 6th lost Cooper and Howard counties to the 4th district , and Gladstone in southwestern Clay County to the 5th district . Meanwhile, the 6th was pushed further into Jackson County , taking in the northeastern portion between the Missouri River and Interstate 70, as well as a small sliver southwest of Independence .
In the 2020 redistricting, more of Clay County was ceded the 5th District, including North Kansas City . The district also moved into the St. Louis metropolitan area for the first time, gaining most of Lincoln County , including its largest city, Troy , from the 3rd district .
#
County
Seat
Population
1
Adair
Kirksville
25,122
3
Andrew
Savannah
18,127
5
Atchison
Rock Port
5,107
7
Audrain
Mexico
24,394
21
Buchanan
St. Joseph
82,956
25
Caldwell
Kingston
8,955
33
Carroll
Carrollton
8,391
41
Chariton
Keytesville
7,399
45
Clark
Kahoka
6,641
47
Clay
Liberty
259,772
49
Clinton
Plattsburg
21,548
61
Daviess
Gallatin
8,551
63
DeKalb
Maysville
9,899
75
Gentry
Albany
6,287
79
Grundy
Trenton
9,815
81
Harrison
Bethany
8,220
87
Holt
Oregon
4,248
95
Jackson
Independence , Kansas City
718,560
103
Knox
Edina
3,723
111
Lewis
Monticello
9,818
113
Lincoln
Troy
64,699
115
Linn
Linneus
11,791
117
Livingston
Chillicothe
14,557
121
Macon
Macon
15,161
127
Marion
Palmyra
28,336
129
Mercer
Princeton
3,469
137
Monroe
Paris
8,698
147
Nodaway
Maryville
20,695
163
Pike
Bowling Green
17,935
165
Platte
Platte City
111,940
171
Putnam
Unionville
4,638
173
Ralls
New London
10,489
175
Randolph
Huntsville
24,109
177
Ray
Richmond
23,182
197
Schuyler
Lancaster
4,053
199
Scotland
Memphis
4,676
205
Shelby
Shelbyville
5,931
211
Sullivan
Milan
5,797
227
Worth
Grant City
1,907
[ edit ] Kansas City – 510,704Independence – 123,011St. Joseph – 72,473Liberty – 30,167Kirksville – 17,530Hannibal – 16,938Moberly – 13,783Troy – 12,686Mexico – 11,469Maryville – 10,633Excelsior Springs – 10,553Smithville – 10,406Kearney – 10,404[ edit ] Chillicothe – 9,107Parkville – 8,541Cameron – 8,513Richmond – 6,013Trenton – 5,609Macon – 5,457Savannah – 5,069Centralia – 4,802Platte City – 4,784Bowling Green – 4,195Brookfield – 4,111Riverside – 4,013Palmyra – 3,613Carrollton – 3,514Vandalia – 3,464Moscow Mills – 3,317Sugar Creek – 3,271Louisiana – 3,199Buckner – 2,945Bethany – 2,915Canton – 2,774Monroe City – 2,652Lawson – 2,541List of members representing the district [ edit ]
Member
Party
Years
Cong
Electoral history
District location
District created March 4, 1853
John S. Phelps (Springfield )
Democratic
March 4, 1853 –
33rd 34th 35th 36th 37th
Redistricted from the 5th district re-elected in 1852 .Re-elected in 1854 .Re-elected in 1856 .Re-elected in 1858 .Re-elected in 1860 .
Austin A. King (Richmond )
Union
March 4, 1863 –
38th
Elected in 1862 .
Robert T. Van Horn (Kansas City )
Republican
March 4, 1865 –
39th 40th 41st
Elected in 1864 .Re-elected in 1866 .Re-elected in 1868 .
Abram Comingo (Independence )
Democratic
March 4, 1871 –
42nd
Elected in 1870 .8th district
Harrison E. Havens (Springfield )
Republican
March 4, 1873 –
43rd
Redistricted from the 4th district re-elected in 1872 .
Charles H. Morgan (Lamar )
Democratic
March 4, 1875 –
44th 45th
Elected in 1874 .Re-elected in 1876 .
James R. Waddill (Springfield )
Democratic
March 4, 1879 –
46th
Elected in 1878 .
Ira S. Haseltine (Springfield )
Greenback
March 4, 1881 –
47th
Elected in 1880 .
John Cosgrove (Boonville )
Democratic
March 4, 1883 –
48th
Elected in 1882 .
John T. Heard (Sedalia )
Democratic
March 4, 1885 –
49th 50th 51st 52nd
Elected in 1884 .Re-elected in 1886 .Re-elected in 1888 .Re-elected in 1890 .7th district
David A. De Armond (Butler )
Democratic
March 4, 1893 –
53rd 54th 55th 56th 57th 58th 59th 60th 61st
Redistricted from the 12th district re-elected in 1892 .Re-elected in 1894 .Re-elected in 1896 .Re-elected in 1898 .Re-elected in 1900 .Re-elected in 1902 .Re-elected in 1904 .Re-elected in 1906 .Re-elected in 1908 .
Vacant
November 23, 1909 –
61st
Clement C. Dickinson (Clinton )
Democratic
February 1, 1910 –
61st 62nd 63rd 64th 65th 66th
Elected to finish De Armond's term .Re-elected in 1910 .Re-elected in 1912 .Re-elected in 1914 .Re-elected in 1916 .Re-elected in 1918 .
William O. Atkeson (Butler )
Republican
March 4, 1921 –
67th
Elected in 1920 .
Clement C. Dickinson (Clinton )
Democratic
March 4, 1923 –
68th 69th 70th
Elected in 1922 .Re-elected in 1924 .Re-elected in 1926 .
Thomas J. Halsey (Holden )
Republican
March 4, 1929 –
71st
Elected in 1928
Clement C. Dickinson (Clinton )
Democratic
March 4, 1931 –
72nd
Elected in 1930 .At-large district
District inactive
March 4, 1933 –
73rd
All representatives elected At-large on a general ticket
Reuben T. Wood (Springfield )
Democratic
January 3, 1935 –
74th 75th 76th
Redistricted from the At-large district re-elected in 1934 .Re-elected in 1936 .Re-elected in 1938 .
Philip A. Bennett (Springfield )
Republican
January 3, 1941 –
77th
Elected in 1940 .Re-elected in 1942 but died before term began.
Vacant
December 7, 1942 –
77th 78th
Marion T. Bennett (Springfield )
Republican
January 12, 1943 –
78th 79th 80th
Elected to finish his father's term .Re-elected in 1944 .Re-elected in 1946 .
George H. Christopher (Amoret )
Democratic
January 3, 1949 –
81st
Elected in 1948 .
Orland K. Armstrong (Springfield )
Republican
January 3, 1951 –
82nd
Elected in 1950 .
William C. Cole (St. Joseph )
Republican
January 3, 1953 –
83rd
Elected in 1952 .1953–1963 [data missing
William Raleigh Hull Jr. (Weston )
Democratic
January 3, 1955 –
84th 85th 86th 87th 88th 89th 90th 91st 92nd
Elected in 1954 .Re-elected in 1956 .Re-elected in 1958 .Re-elected in 1960 .Re-elected in 1962 .Re-elected in 1964 .Re-elected in 1966 .Re-elected in 1968 .Re-elected in 1970 .
1963–1973 [data missing
Jerry Litton (Chillicothe )
Democratic
January 3, 1973 –
93rd 94th
Elected in 1972 .Re-elected in 1974 .1973–1983 [data missing
Vacant
August 3, 1976 –
94th
Tom Coleman (Gladstone )
Republican
November 2, 1976 –
94th 95th 96th 97th 98th 99th 100th 101st 102nd
Elected to finish Litton's term .Re-elected in 1976 .Re-elected in 1978 .Re-elected in 1980 .Re-elected in 1982 .Re-elected in 1984 .Re-elected in 1986 .Re-elected in 1988 .Re-elected in 1990 .
1983–1993 [data missing
Pat Danner (Kansas City )
Democratic
January 3, 1993 –
103rd 104th 105th 106th
Elected in 1992 .Re-elected in 1994 .Re-elected in 1996 .Re-elected in 1998 .1993–2003 [data missing
Sam Graves (Tarkio )
Republican
January 3, 2001 –
107th 108th 109th 110th 111th 112th 113th 114th 115th 116th 117th 118th 119th
Elected in 2000 .Re-elected in 2002 .Re-elected in 2004 .Re-elected in 2006 .Re-elected in 2008 .Re-elected in 2010 .Re-elected in 2012 .Re-elected in 2014 .Re-elected in 2016 .Re-elected in 2018 .Re-elected in 2020 .Re-elected in 2022 .Re-elected in 2024 .
2003–2013
2013–2023
2023–present
Election results from statewide races [ edit ]
^ "My Congressional District" .^ "2022 Cook PVI: District Map and List" . Cook Political Report . July 12, 2022. Retrieved January 10, 2023 .^ "UPDATE: House Redistricting Committee Unveils Map - OzarksFirst.com" . Archived from the original on May 11, 2011. Retrieved March 31, 2011 .^ 1996 Election Results ^ 1998 Election Results ^ 2000 Election Results ^ 2002 Election Results ^ Official Manual of the State of Missouri, 2005–2006, page 637
^ Official Manual of the State of Missouri, 2007–2008, page 649
^ 2008 Election Results ^ "November 2, 2010 General Election" . Missouri Secretary of State . November 30, 2010. Archived from the original on February 20, 2011. Retrieved April 5, 2014 .^ House, Scott (May 14, 2005). "Fact Sheet on 6000 Caves" . The Missouri Speleological Survey. Archived from the original on May 9, 2008. Retrieved March 16, 2008 . ^ "State of Missouri - Election Night Results" .^ "2016 General Election Official Results" . Missouri Secretary of State. November 8, 2016. Retrieved November 30, 2016 .^ "All Results State of Missouri – State of Missouri – General Election, November 03, 2020" . Missouri Secretary of State . Retrieved December 9, 2020 .
39°56′53″N 93°17′37″W / 39.94806°N 93.29361°W / 39.94806; -93.29361


