1884 Colorado gubernatorial election
Appearance
| |||||||||||||||||
| |||||||||||||||||
 County results Eaton: 40–50% 50–60% 60–70% Adams: 40–50% 50–60% 60–70% | |||||||||||||||||
| |||||||||||||||||
| Elections in Colorado |
|---|
 |
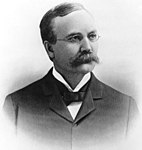
The 1884 Colorado gubernatorial election was held on November 4, 1884. Republican nominee Benjamin Harrison Eaton defeated Democratic nominee Alva Adams with 50.74% of the vote.
General election
[edit]Candidates
[edit]Major party candidates
- Benjamin Harrison Eaton, Republican
- Alva Adams, Democratic
Other candidates
- John E. Washburn, Greenback
Results
[edit]| Party | Candidate | Votes | % | ±% | |
|---|---|---|---|---|---|
| Republican | Benjamin Harrison Eaton | 33,845 | 50.74% | +3.83% | |
| Democratic | Alva Adams | 30,743 | 46.09% | −4.98% | |
| Greenback | John E. Washburn | 2,104 | 3.15% | +1.16% | |
| Majority | 3,102 | 4.65% | |||
| Turnout | 66,692 | ||||
| Republican gain from Democratic | Swing | ||||
By county
[edit]| County | Eaton % | Eaton # | Adams % | Adams # | Washburn % | Washburn # | Total |
|---|---|---|---|---|---|---|---|
| Arapahoe | 49.12% | 6,488 | 45.99% | 6,074 | 4.87% | 644 | 13,206 |
| Bent | 42.26% | 366 | 54.38% | 471 | 3.34% | 29 | 866 |
| Boulder | 51.62% | 1,446 | 35.91% | 1,006 | 12.45% | 349 | 2,801 |
| Chaffee | 52.30% | 1,121 | 47.41% | 1,016 | 0.27% | 6 | 2,143 |
| Clear Creek | 57.83% | 1,380 | 40.86% | 975 | 1.29% | 31 | 2,386 |
| Conejos | 32.62% | 429 | 67.30% | 885 | 0.07% | 1 | 1,315 |
| Costilla | 49.23% | 483 | 50.77% | 498 | 0.00% | 0 | 981 |
| Custer | 56.76% | 789 | 42.87% | 596 | 0.35% | 5 | 1,390 |
| Delta | 50.97% | 210 | 47.81% | 197 | 1.21% | 5 | 412 |
| Dolores | 53.17% | 184 | 46.82% | 162 | 0.00% | 0 | 346 |
| Douglas | 52.31% | 282 | 46.93% | 253 | 0.74% | 4 | 539 |
| Eagle | 57.77% | 286 | 41.81% | 207 | 0.40% | 4 | 495 |
| El Paso | 65.93% | 1,231 | 30.95% | 578 | 3.10% | 58 | 1,867 |
| Elbert | 51.18% | 216 | 48.57% | 205 | 0.23% | 1 | 422 |
| Fremont | 48.91% | 812 | 44.33% | 736 | 6.74% | 112 | 1,660 |
| Garfield | 62.01% | 240 | 37.98% | 147 | 0.00% | 0 | 387 |
| Gilpin | 60.00% | 1,101 | 35.74% | 656 | 4.25% | 78 | 1,835 |
| Grand | 58.10% | 251 | 40.74% | 176 | 1.15% | 5 | 432 |
| Gunnison | 48.80% | 1,121 | 49.93% | 1,147 | 1.26% | 29 | 2,297 |
| Hinsdale | 55.65% | 241 | 43.64% | 189 | 0.69% | 3 | 433 |
| Huerfano | 35.70% | 407 | 62.10% | 708 | 2.19% | 25 | 1,140 |
| Jefferson | 50.56% | 843 | 45.53% | 759 | 3.89% | 65 | 1,667 |
| La Plata | 44.18% | 627 | 52.57% | 746 | 3.24% | 46 | 1,419 |
| Lake | 50.98% | 3,135 | 47.51% | 2,922 | 1.49% | 92 | 6,149 |
| Larimer | 52.18% | 1,005 | 40.29% | 776 | 7.52% | 145 | 1,926 |
| Las Animas | 44.27% | 1,113 | 55.73% | 1,401 | 0.00% | 0 | 2,514 |
| Mesa | 50.21% | 347 | 49.79% | 344 | 0.00% | 0 | 691 |
| Montrose | 55.30% | 370 | 43.94% | 294 | 0.74% | 5 | 669 |
| Ouray | 49.94% | 451 | 50.06% | 452 | 0.00% | 0 | 903 |
| Park | 53.25% | 761 | 45.20% | 646 | 1.53% | 22 | 1,429 |
| Pitkin | 54.41% | 591 | 45.58% | 495 | 0.00% | 0 | 1,086 |
| Pueblo | 46.64% | 1,549 | 52.15% | 1,732 | 1.20% | 40 | 3,321 |
| Rio Grande | 53.28% | 405 | 45.26% | 344 | 1.44% | 11 | 760 |
| Routt | 56.66% | 102 | 43.33% | 78 | 0.00% | 0 | 180 |
| Saguache | 48.70% | 490 | 51.29% | 516 | 0.00% | 0 | 1,006 |
| San Juan | 50.08% | 585 | 48.88% | 571 | 1.02% | 12 | 1,168 |
| San Miguel | 61.70% | 427 | 38.15% | 571 | 0.14% | 1 | 692 |
| Summit | 51.18% | 605 | 48.30% | 571 | 0.50% | 6 | 1,182 |
| Weld | 54.94% | 1,355 | 34.14% | 842 | 10.90% | 269 | 2,466 |
References
[edit]- ^ Guide to U.S. elections. CQ Press. 2005. ISBN 9781568029818. Retrieved June 23, 2020.


