Wikipedia:Reference desk/Archives/Mathematics/2018 September 2
| Mathematics desk | ||
|---|---|---|
| < September 1 | << Aug | September | Oct >> | Current desk > |
| Welcome to the Wikipedia Mathematics Reference Desk Archives |
|---|
| The page you are currently viewing is a transcluded archive page. While you can leave answers for any questions shown below, please ask new questions on one of the current reference desk pages. |
September 2
[edit]Trying to understand geometric intuition behind correlation’s proportionality to area of intersection of areas under functions
[edit]
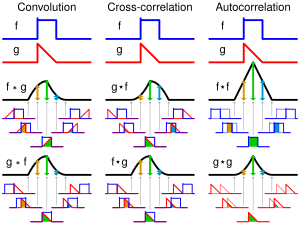
Tophtucker asked me the questions below about my image on the right on File_talk:Comparison_convolution_correlation.svg:
... I've been staring at this (particularly the correlation ones) and trying to think through why the nice color-coded area of intersection (i.e. overlap) is proportionate to (not equal to, is it?) the correlation. Here's how far I think I've gotten:
Correlation is covariance divided by product of standard deviations. You can get covariance by going over each point and averaging the product of the distances from the mean for each function: (1/n) * Σ(f_i - μ_f)*(g_i - μ_g). In your example functions, if we imagine they're zero forever to the left and right, the mean is zero, so this simplifies to just averaging the product of the values at each point: (1/n) * Σ f_i * g_i. That's not exactly the area of intersection, but it's the area of the product. I'm trying to think when that would be the same as the area of the intersection. It's zero when one of them is zero, at least. If one is 1 and the other's 0.5, then the product is also the intersection. But if they're both 0.5, the intersection is 0.5 but the product is 0.25. If one is negative and one is positive at that point, then the overlap is zero but the contribution to covariance is the product, which is nonzero negative.
And then ultimately you're dividing by the product of the standard deviations, but that just sorta rescales it the whole thing; I don't *think* it would make product and overlap equal, but maybe....?
That's as far as I've gotten and I don't feel very confident in even that hahah. Does that sorta make sense? How would you explain it? Thank you so much.
Not being confident about correlation and covariance, I'm unsure how to answer. Can someone please help?
Secondly, have I made any mistakes in the figure? If so, can you please point out corrections I should make?
Thanks,
cmɢʟee⎆τaʟκ 22:19, 2 September 2018 (UTC)
- I haven't tried to understand this yet. It all looks very pretty. Is it intentional that the square pulse has a blip on the leading edge? -- SGBailey (talk) 06:34, 6 September 2018 (UTC)
- Thanks, SGBailey. The blip is so that the reader can tell when it's flipped horizontally, as a square pulse is symmmetrical otherwise. Cheers, cmɢʟee⎆τaʟκ 13:32, 8 September 2018 (UTC)
